Biomechanical Analysis of the Shot-Put event at the 2004 Athens Olympic Games
The only Biomechanical Analysis that was performed at the Athens Olympic Games 2004
By Gideon Ariel in ISBS Proceedings on Saturday, August 20, 2005
The XXIIIrd International Symposium on Biomechanics in Sports, edited by Prof. Qing Wang, featured a study on the biomechanical analysis of the shot-put event at the 2004 Athens Olympic Games. The study, conducted by Gideon Ariel, Ann Penny, John Probe, and Alfred Finch, used multiple high-speed digital video cameras to capture the performances of athletes. The cameras were placed at specific angles on the field to capture three-dimensional biomechanical results. The study found that the shot put distance depends on a variety of factors, including the release height, release velocity, and release angle. The study also compared the performances of skilled and unskilled athletes, finding differences in timing and selective joint range of motion.
Article Synopsis
This article presents a comprehensive study on the biomechanics of human motion, specifically focusing on the movements involved in gymnastics. The research includes an in-depth analysis of space requirements of seated operators at the Wright-Patterson Air Force Base, as well as a cinematographic analysis of human motion patterns by Plagenhoef.
The article also features a case study on giant swings on parallel bars by Prassas, Ostarello, and Inouye, presented at the XXII International Society of Biomechanics in Sports. Additionally, it discusses a kinematic comparison of overgrip and undergrip dismount giant swings on uneven parallel bars by Prassas, Papadopoulos, and Krug.
The optimal performance of the backward longswing on rings is also explored by Yeadon and Brewin. The article concludes with a mention of the TRRDE Co., Ltd.'s computerized exercise system and its application in the industry, sports, and human performance.
Tip: use the left and right arrow keys
PROCEEDINGS
OF XXIII INTERNATIONAL SYMPOSIUM
ON BIOMECHANICS IN SPORTS
2005
Edited by
Qing WANG
VOLUME 1
THE CHINA INSTITUTE OF SPORT SCIENCE
This is to certify that
The XXIIIrd International Symposium
on Biomechanics in Sports
Prof. Qing Wang PhD Chairman ISBS 2005
BIOMECHANICAL ANALYSIS OF THE SHOT-PUT EVENT
AT THE 2004 ATHENS OLYMPIC GAMES
Gideon Ariel',Ann Penny', John Probe.' and Alfred Finch2
'Institute for Biomechanical Research, Coto Research Center, Coto De Caza California, 2lndiana State University, Terre Haute, Indiana, USA
The purpose of this study was to analyze the best shot put performances in the Athens 2004 Olympic Games. Multiple high speed digital video cameras were placed in specific locations on the field at proper angles in order to capture the performance of the athletes in the preliminaries and finals. Two stationary cameras were placed at 45 degrees to each other. In addition 3 more cameras used by the NBC broadcasting were used to assist the other 2 cameras. Temporal and kinematics variables were calculated from the videos records and were analyzed yielding three-dimensional biomechanical results. Patterns of the segmental movements were used rather than absolute values, to assist the athletes and the coaches in the analysis of the performances. Kinematics parameters for the best 3 final performers were presented in this study.
KEY WORDS: shot-put analysis, kinematic analysis, angular velocities, linear velocities, angle of release, 2004 Olympic Games
INTRODUCTION: The Shot Put competition at the 2004 Athens Olympiad was held in the Ancient Olympia stadium. This was the site of the ancient Games of the Olympiad, 2,800 years ago. Despite skepticism from the rest of the world, the organizers of the Athens games did so many things right and nothing exemplified this more than holding the shot put competition at Olympia. In a games already steeped in history, the organizers thoughtfully connected the ancient and modern Olympics in a serene setting that was so unusual that it will probably be remembered as one of the highlights of these games whenever they are recalled. The biomechanical analysis of the Shot Put event was sponsored by the International Track and Field Coaches Association. This was the only biomechanical analysis performed at the Athens Olympic Games where cameras were placed on the performance field. The competition was exciting and the setting was as intimate as it was historical. The shot put normally takes place in the middle of the field with the track separating the crowd from the event that seems so distant as if it's happening in another place. In Olympia, the shot put took center stage as the only event being competed with 15,000+ fans watching right on top of it from the grassy knoll right next to the pit. It was great to be a part of it. The crowd was treated to a fascinating men's event, which ended in controversy when the Ukraine's Yuriy Bilonog tied the United States' Adam Nelson, which meant Bilonog would really beat Nelson, unless Nelson could come back with one last amazing throw, which he did, except he fouled, although he stated he did not foul, but video images really showed that a foul ocurred during the crucial final attempt. So Nelson had to settle for the silver, while two other Americans, John Godina and Reese Hoffa, finished out of contention, far short of his prediction that Americans would sweep the event.
The purpose of this project was to collect video records of competitors at the 2004 Olympic Games at Olympia Greece where the Shot Put event was conducted. Multiple cameras were placed in key angular locations to capture the activities during the Olympic Games. The cameras were place on the field at specific distance and angle relative to the shot put circle. In addition to the stationary cameras on the field, cameras outputs from the television broadcasting companies were used in assisting the stationary cameras. All throws were recorded at 60 frames per second and performances were analyzed for the present study. All the Men and Women throws at the preliminary and finals were collected and analyzed. Due to publishing restrictions, only the best 3 performers were analyzed for the present paper. The parameters measured were the body's segmental velocities, center of mass pathway, and release velocity. The kinematic patterns of the various athletes' segmental positioning were presented for visual interpretation.
272 ISBS 2005 / Beijing, China
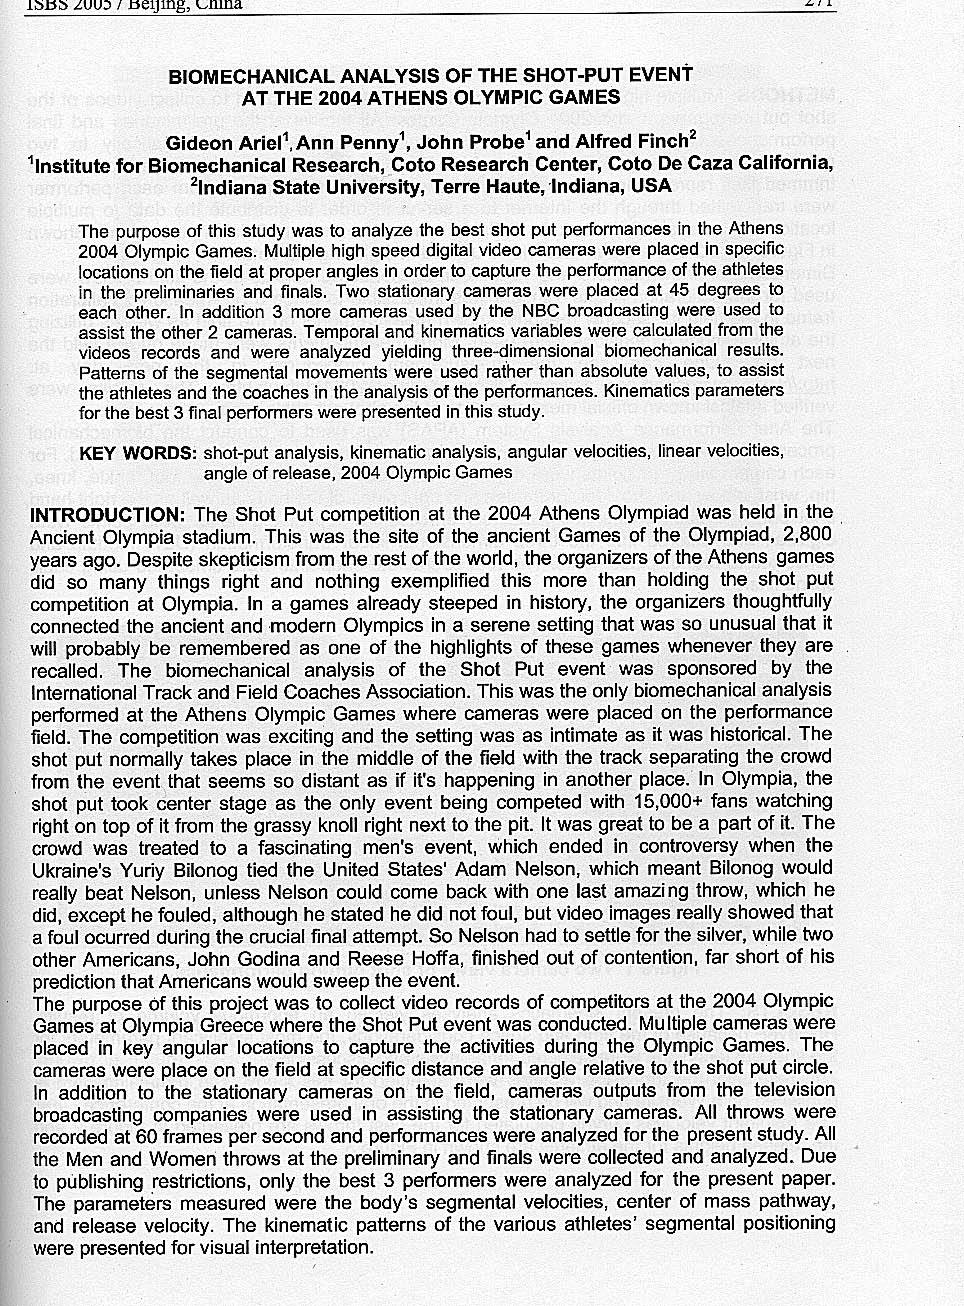
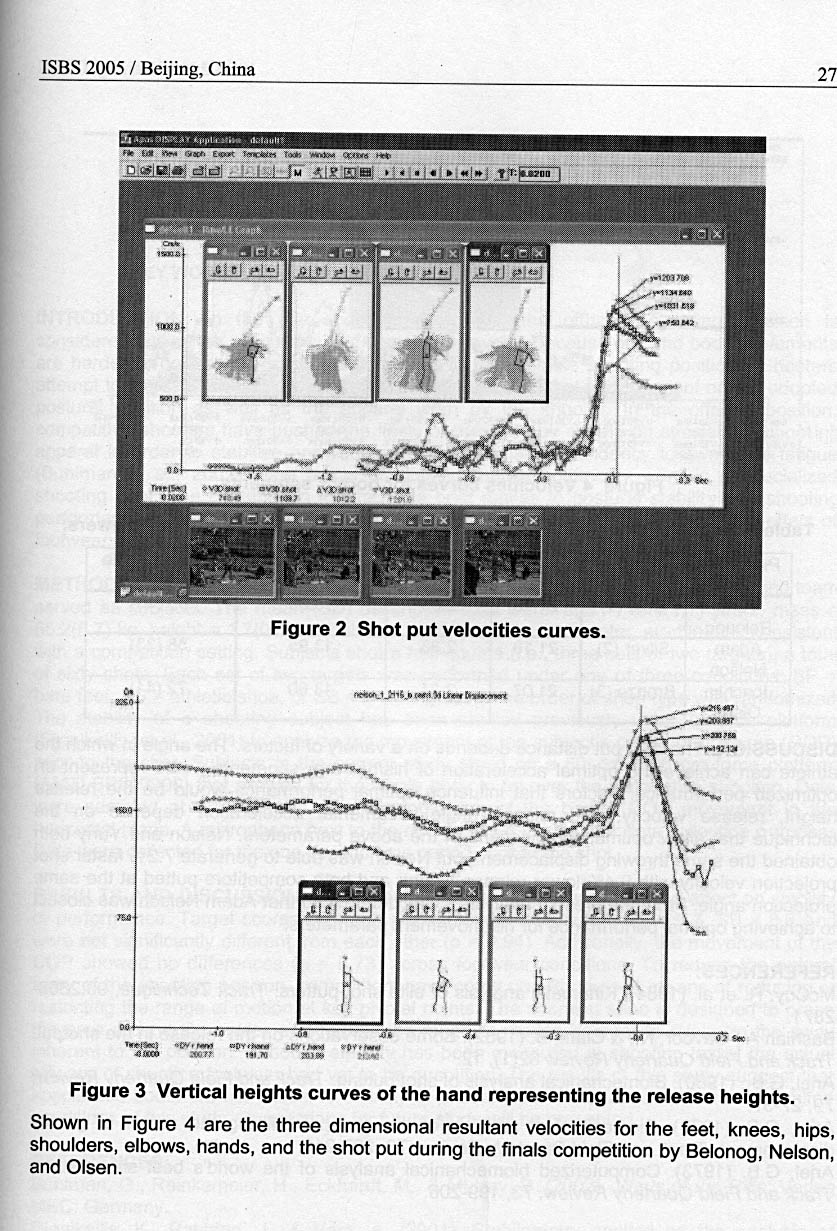
METHODS: Multiple high speed digital cameras (60 fps) were used to collect videos of the shot put performers in the 2004 Olympic Games. All throws at the preliminaries and final performances were recorded. Videos collected were transferred automatically to two notebook computers via IEEE1394 interface PCMCIA cards, and synchronized to produce trimmed files representing the complete throws. The trimmed videos from each performer were transmitted through the Internet to a server in order to distribute the data to multiple locations for analysis. All the video digital cameras recorded at 60 fields per second. Shown in Figure 1 are 2 of the 5 cameras views utilized in digitizing the data.
Dimensions of known factors and various other measured objects in the field of view were used for the calibration points. Since it was impossible to place a pre-measured calibration frame in the field for security reasons, known measurements on the field as well as utilizing the athletes' body dimensions were used. More measurements were made on the field the next day. One can see the measurement procedures in the next day at: http://www.macrosport.com/activities/Olympic-Games-2004/default.htm. The results were verified against known official measurements of the shot put circle area.
The Ariel Performance Analysis System (APAS) was used to conduct the biomechanical processes. Synchronized data sequences from each of the cameras views were utilized. For each camera view, 19 points were digitized. The body parts included the foot, ankle, knee, hip, wrist, elbow and shoulder for the left and right sides of the body as well as the right hand, shot put, and base of the neck, mastoid process the top of the head. Data points were digitized and entered into the three dimensional linear transformation (DLT) module and converted to real displacements. The real coordinate endpoints were smoothed using cubic spline filter.
Figure 1 Two camera views of shot putting performance.
RESULTS: The present kinematics analyses yielded an enormous volume of results. However, because of the time and space considerations, the most significant parameters for the shot put technique were selected for analysis and discussion.
The results of the top 3 top athletes were selected for this study. The remaining data is published on a Website and will be presented in the oral presentation at the conference. The resultant velocities curves calculated for the best throws are presented in Figure 2 and the release heights for the athletes are shown in Figure 3.
ISBS 2005 / Beijing, China 27
Figure 2 Shot put velocities curves.
Figure 3 Vertical heights curves of the hand representing the release heights.
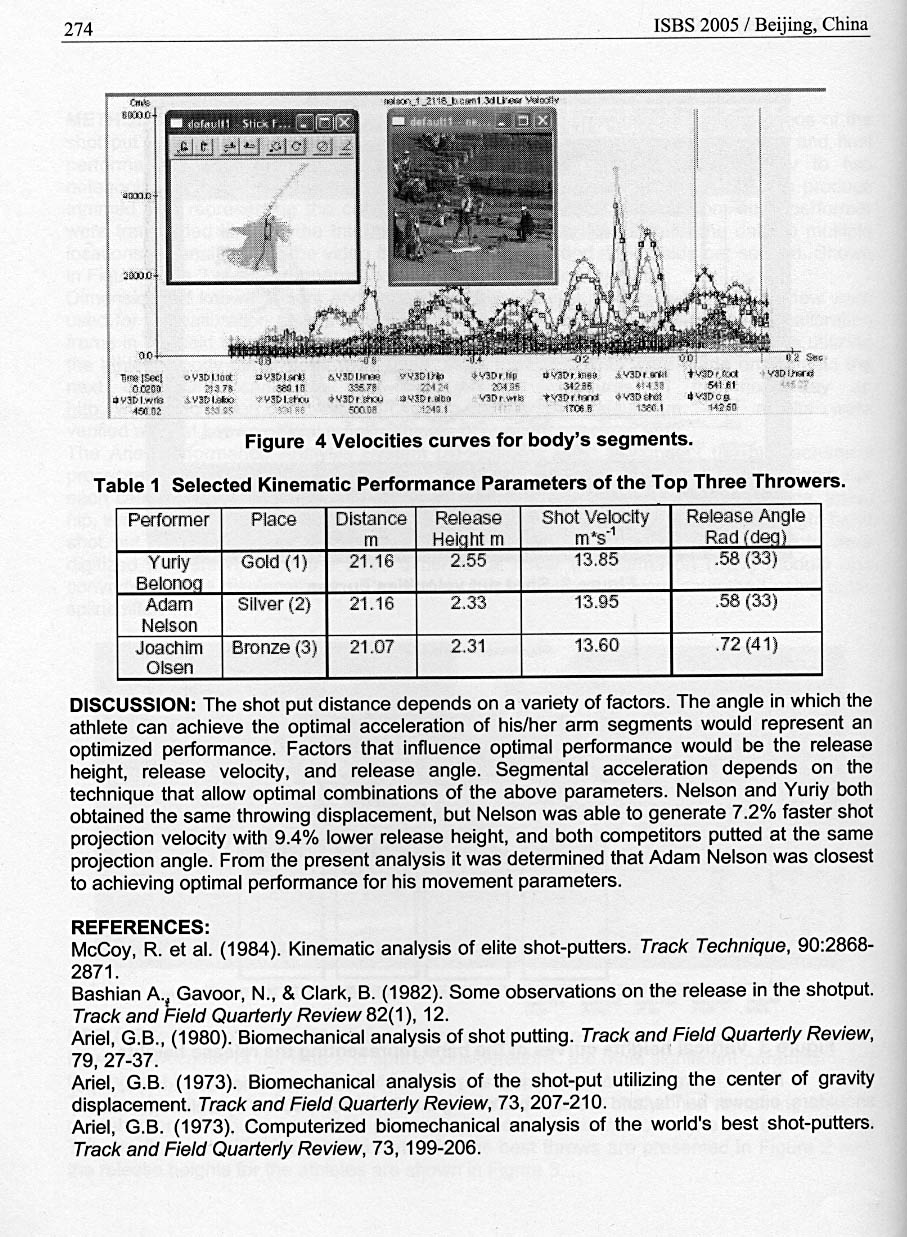
Shown in Figure 4 are the three dimensional resultant velocities for the feet, knees, hips, shoulders, elbows, hands, and the shot put during the finals competition by Belonog, Nelson, and Olsen.
Figure 4 Velocities curves for body's segments.
Table 1 Selected Kinematic Performance Parameters of the Top Three Throwers.
Performer Place Distance Release Shot Velocity Release Angle
m Height m m's' Rad (deq)
Yuriy Gold (1) 21.16 2.55 13.85 .58 (33)
Belonoq
Adam Silver (2) 21.16 2.33 13.95 .58 (33)
Nelson
Joachim Bronze (3) 21.07 2.31 13.60 .72 (41)
Olsen
DISCUSSION: The shot put distance depends on a variety of factors. The angle in which the athlete can achieve the optimal acceleration of his/her arm segments would represent an optimized performance. Factors that influence optimal performance would be the release height, release velocity, and release angle. Segmental acceleration depends on the technique that allow optimal combinations of the above parameters. Nelson and Yuriy both obtained the same throwing displacement, but Nelson was able to generate 7.2% faster shot projection velocity with 9.4% lower release height, and both competitors putted at the same projection angle. From the present analysis it was determined that Adam Nelson was closest to achieving optimal performance for his movement parameters.
REFERENCES:
McCoy, R. et al. (1984). Kinematic analysis of elite shot-putters. Track Technique, 90:2868-2871.
Bashian A.i Gavoor, N., & Clark, B. (1982). Some observations on the release in the shotput. Track and Field Quarterly Review 82(1), 12.
Ariel, G.B., (1980). Biomechanical analysis of shot putting. Track and Field Quarterly Review, 79, 27-37.
Ariel, G.B. (1973). Biomechanical analysis of the shot-put utilizing the center of gravity displacement. Track and Field Quarterly Review, 73, 207-210.
Ariel, G.B. (1973). Computerized biomechanical analysis of the world's best shot-putters. Track and Field Quarterly Review, 73, 199-206.
~ dofot,Hl Slick
ISBS 2005 / Beijing, China 717
KINEMATIC ANALYSIS OF MALE COLLEGIATE RUNNERS DURING
DIFFERENT INTERVALS OF 1500 M TIME TRIAL
Hisham Mughrabi', Alfred Finch' and Gideon Ariel2
'Biomechanics Laboratory, Indiana State University, Terre Haute, Indiana, USA
2lnstitute for Biomechanical Research, Coto Research Center, Coto De Caza,
California, USA
INTRODUCTION: This project examined the influence of race duration on running gait. The purpose of this study was to investigate the kinematic alterations at different distances for collegiate male runners during a 1500 m time trial.
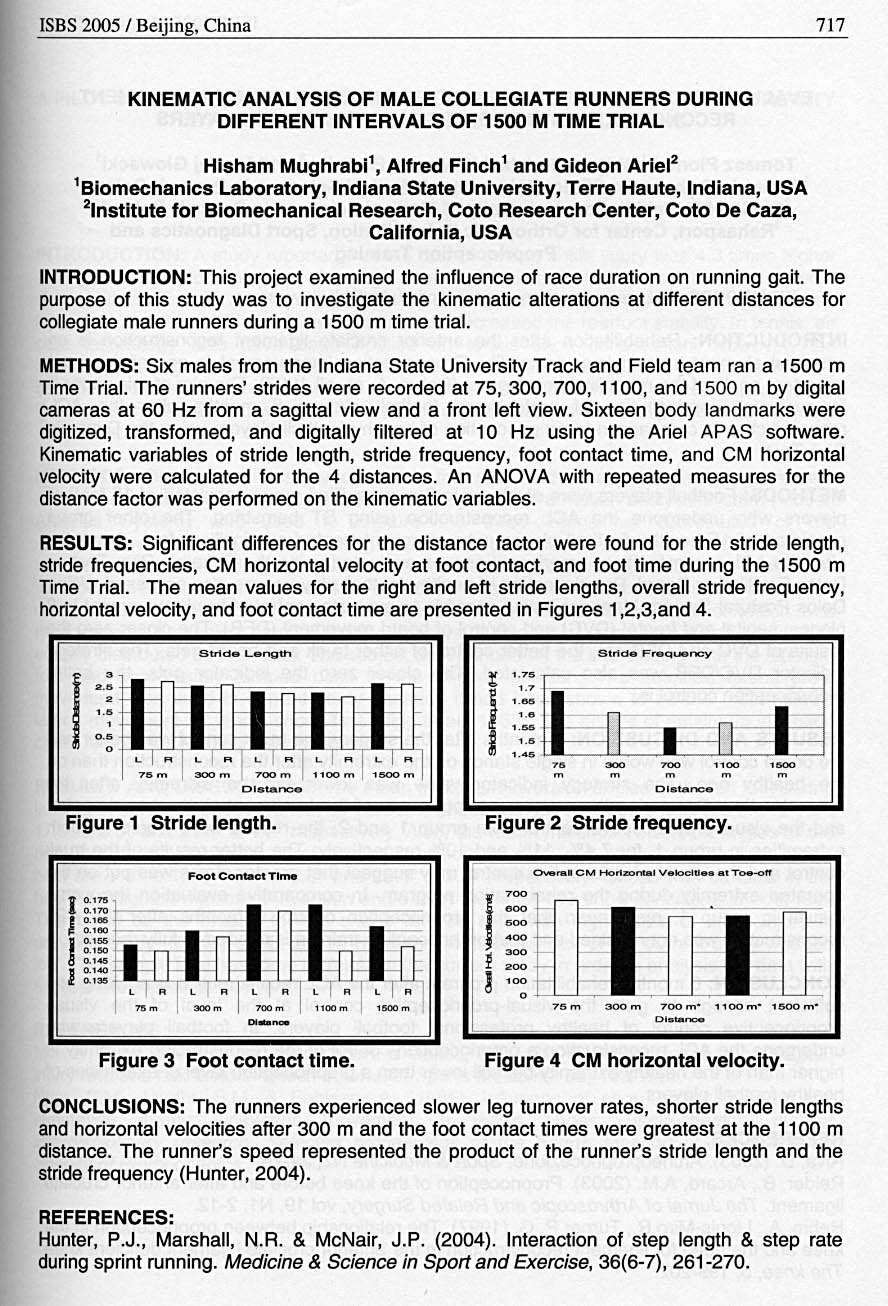
METHODS: Six males from the Indiana State University Track and Field team ran a 1500 m Time Trial. The runners' strides were recorded at 75, 300, 700, 1100, and 1500 m by digital cameras at 60 Hz from a sagittal view and a front left view. Sixteen body landmarks were digitized, transformed, and digitally filtered at 10 Hz using the Ariel APAS software. Kinematic variables of stride length, stride frequency, foot contact time, and CM horizontal velocity were calculated for the 4 distances. An ANOVA with repeated measures for the distance factor was performed on the kinematic variables.
RESULTS: Significant differences for the distance factor were found for the stride length, stride frequencies, CM horizontal velocity at foot contact, and foot time during the 1500 m Time Trial. The mean values for the right and left stride lengths, overall stride frequency, horizontal velocity, and foot contact time are presented in Figures 1,2,3,and 4.
Figure 1 Stride length.
Figure 3 Foot contact time.
Figure 2 Stride frequency.
Figure 4 CM horizontal velocity.
Stride Length
i i i i
L R L R L R R i L R
75 m 300 m 700 m 1100 m 1500 m
olstence
2 1.5 1 0.5 0
Foot Contact Ti,,,.
0.175 8 0.170 0.106 0.160
IIiriirI
135
L R L R
75 m 300 m
Lin
R L R L R
700 m 1100 m 1500 m d..no.
i
Overall CM Horizontal Velocities at Toe-Oft
700 600
J600
400
F 300
200
100
0
700 m� 1 100 m� 1500 m� Di lance
75 m
CONCLUSIONS: The runners experienced slower leg turnover rates, shorter stride lengths and horizontal velocities after 300 m and the foot contact times were greatest at the 1100 m distance. The runner's speed represented the product of the runner's stride length and the stride frequency (Hunter, 2004).
REFERENCES:
Hunter, P.J., Marshall, N.R. & McNair, J.P. (2004). Interaction of step length & step rate during sprint running. Medicine & Science in Sport and Exercise, 36(6-7), 261-270.
ISBS 2005 / Beijing, China 953
KINEMATICS OF GIANT SWINGS ON THE PARALLEL BARS
- Prassas' and G. ArieI2
'California State University East Bay, Hayward, CA USA 2Coto Research Center, Coto De Caza CA USA
The purpose of this study was to investigate the kinematics of giant swings on the parallel bars. A secondary purpose was to compare giants executed from a cast to the giants following, and to compare skilled vs. unskilled performances. A total of eight giants were studied. Results showed that, with few exceptions, giant swings performed on the parallel bars exhibit similar motion patterns to giants performed on other apparatuses. Between-apparatus differences in motion patterns of the knee (quantified), elbow and radioulnar (not quantified due to substantial out-of-plane components) joints were attributed to limitations mostly imposed by apparatus design. Skilled vs. unskilled differences�most pronounced at the shoulder joint�were related to both timing and ROM issues.
KEY WORDS: giant swings, parallel bars, gymnastics
INTRODUCTION: Giant swings have been routinely performed by gymnasts on the high bar, rings, and uneven bars and have been the subject of several investigations (Arampatzis & Bruggemann, 1998; Prassas et al., 1998; Yeadon & Brewin, 2003). However, there is only one scientific inquiry on the recently introduced giant swings on the parallel bars (Prassas et al., 2004). Although there are similarities between the mechanics of giant swings already studied and one might expect similar mechanics for parallel bar giants (depicted in Figure 1), the scarcity of data on the latter precludes definite conclusions. The purpose of this study was to investigate the kinematics of giant swings on the parallel bars. A secondary purpose was to compare giants executed from a cast and following a previous giant and to compare skilled vs. unskilled performances.
METHODS: Each of four collegiate gymnasts performed 2 consecutive giant swings beginning from a high cast. The performances were videotaped with a 60 Hz video camera and analyzed independently utilizing the Ariel Performance Analysis System (APAS). The left foot; the knee, shoulder, and elbow joints; the hand, the top of the head, and a point on the bar were digitized. The raw data was digitally smoothed with a cut-off frequency of 7 Hz before being submitted to further analysis. Dempster's (1955) data as presented by Plagenhoef (1971) was utilized to predict the segmental and total body anthropometric parameters necessary to solve the mechanical equations. Data from the APAS was downloaded to EXCEL for further processing and presentation of results..
RESULTS AND DISCUSSION: Mean kinematic results for all 8 giants are shown in Table 1. Since the height of the cast varied between gymnasts, results are presented commencing with each gymnast's center of mass positioned 45 degrees above the bars. Bar levels I/II represent the instant when the gymnast's center of mass (CM) was level with the bars in the downswings/upswings, respectively. Bottom represents the point below the bars where the CM vertical velocity changed from negative to positive. Vertical represents the point above the bar where the CM is vertically aligned with the gymnast's hands. Data in Table 1 show that gymnasts perform giants on the parallel bars in a similar fashion as in apparatuses such as the high bar and uneven bars with a noticeable exception regarding knee joint motion.
This exception, however, is due to apparatus' restrictions, i.e. gymnasts must flex their knee joints as they pass through the bottom to accommodate for the physical dimensions (height) of the parallel bars. Another difference exists in the motion at the elbow and radioulnar joints. The motion at these joints, however have a substantial out of plane component, which could not be quantified in the present study.
Although the main purpose of the study was neither to compare giants performed from a cast and as a follow up to a previous giant, nor to compare skilled vs. unskilled performances,
954 ISBS 2005 / Beijing, China
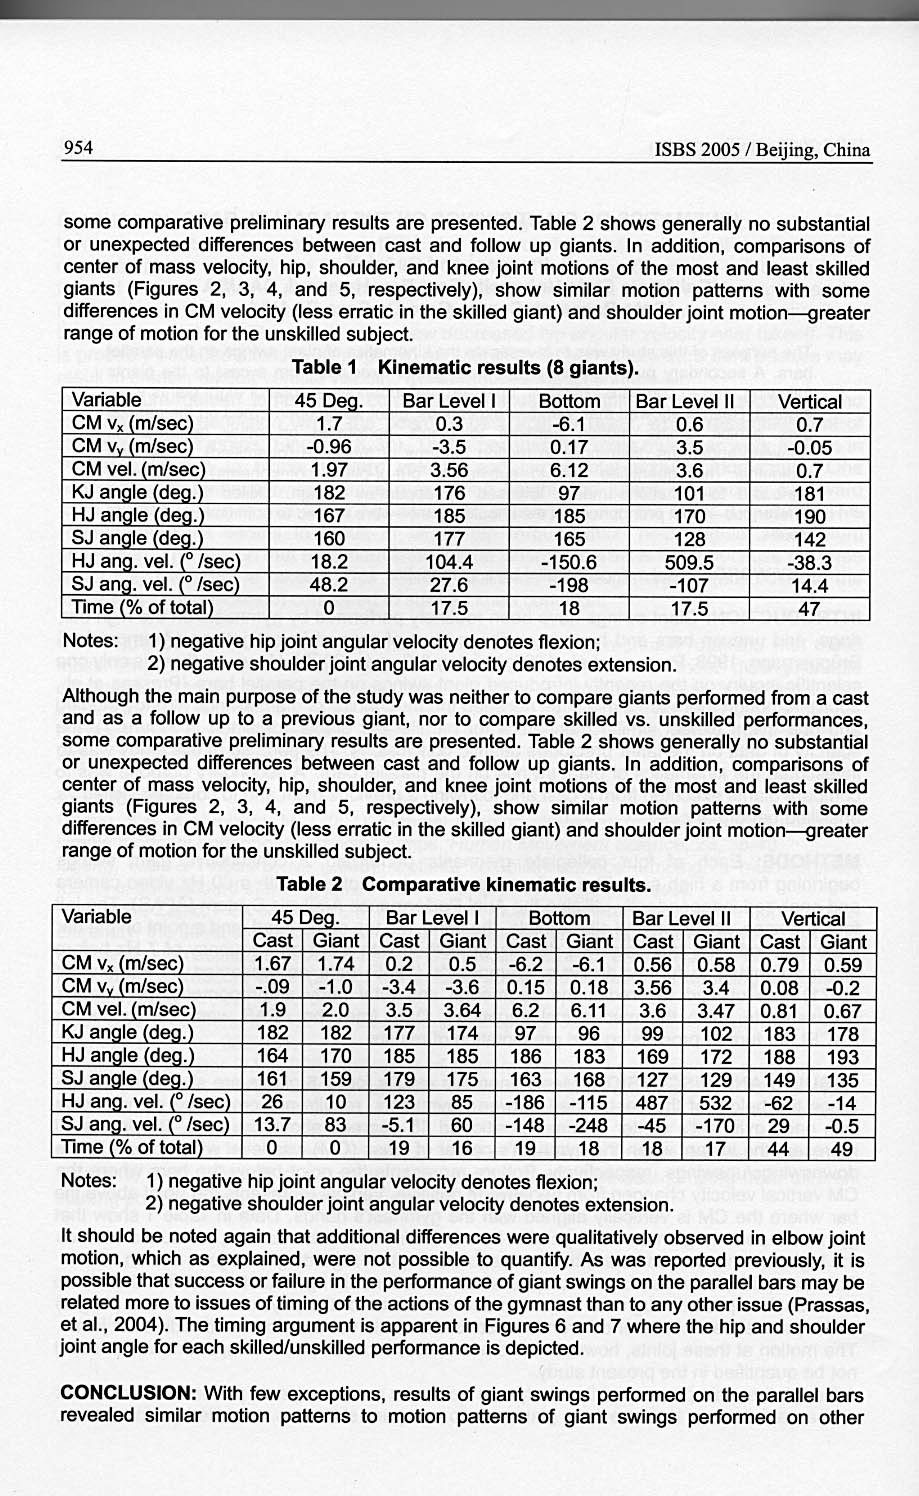
some comparative preliminary results are presented. Table 2 shows generally no substantial or unexpected differences between cast and follow up giants. In addition, comparisons of center of mass velocity, hip, shoulder, and knee joint motions of the most and least skilled giants (Figures 2, 3, 4, and 5, respectively), show similar motion patterns with some differences in CM velocity (less erratic in the skilled giant) and shoulder joint motion-greater range of motion for the unskilled subject.
Table 1 Kinematic results (8 giants).
Variable 45 Deg. Bar Level I Bottom Bar Level II Vertical
CM vX (m/sec) 1.7 0.3 -6.1 0.6 0.7
CM (m/sec) -0.96 -3.5 0.17 3.5 -0.05
CM vel. (m/sec) 1.97 3.56 6.12 3.6 0.7
KJ angle (deg.) 182 176 97 101 181
HJ angle (deg.) 167 185 185 170 190
SJ angle (deg.) 160 177 165 128 142
HJ anq. vel. (� /sec) 18.2 104.4 -150.6 509.5 -38.3
SJ ang. vel. (� /sec) 48.2 27.6 -198 -107 14.4
Time (% of total) 0 17.5 18 17.5 47
Notes: 1) negative hip joint angular velocity denotes flexion;
- negative shoulder joint angular velocity denotes extension.
Although the main purpose of the study was neither to compare giants performed from a cast and as a follow up to a previous giant, nor to compare skilled vs. unskilled performances, some comparative preliminary results are presented. Table 2 shows generally no substantial or unexpected differences between cast and follow up giants. In addition, comparisons of center of mass velocity, hip, shoulder, and knee joint motions of the most and least skilled giants (Figures 2, 3, 4, and 5, respectively), show similar motion patterns with some differences in CM velocity (less erratic in the skilled giant) and shoulder joint motion-greater range of motion for the unskilled subject.
Table 2 Comparative kinematic results.
Variable 45 Deg. Bar Level I Bottom Bar Level II Vertical
Cast Giant Cast Giant Cast Giant Cast Giant Cast Giant
CM v,~ (m/sec) 1.67 1.74 0.2 0.5 -6.2 -6.1 0.56 0.58 0.79 0.59
CM v� (m/sec) -.09 -1.0 -3.4 -3.6 0.15 0.18 3.56 3.4 0.08 -0.2
CM vel. (m/sec) 1.9 2.0 3.5 3.64 6.2 6.11 3.6 3.47 0.81 0.67
KJ angle (deg.) 182 182 177 174 97 96 99 102 183 178
HJ angle (deg.) 164 170 185 185 186 183 169 172 188 193
SJ angle (deg.) 161 159 179 175 163 168 127 129 149 135
HJ ang. vel. (� /sec) 26 10 123 85 -186 -115 487 532 -62 -14
SJ ang. vel. (� /sec) 13.7 83 -5.1 60 -148 -248 -45 -170 29 -0.5
Time (% of total) 0 0 19 16 19 18 18 17 44 49
Notes: 1) negative hip joint angular velocity denotes flexion;
- negative shoulder joint angular velocity denotes extension.
It should be noted again that additional differences were qualitatively observed in elbow joint motion, which as explained, were not possible to quantify. As was reported previously, it is possible that success or failure in the performance of giant swings on the parallel bars may be related more to issues of timing of the actions of the gymnast than to any other issue (Prassas, et al., 2004). The timing argument is apparent in Figures 6 and 7 where the hip and shoulder joint angle for each skilled/unskilled performance is depicted.
CONCLUSION: With few exceptions, results of giant swings performed on the parallel bars revealed similar motion patterns to motion patterns of giant swings performed on other
ISBS 2005 / Beijing, China 955
apparatuses. Marked differences seen in motion patterns of the knee (quantified), elbow and radioulnar joints (the last two were not quantified due to substantial out-of-plane components) were attributed to limitations imposed by apparatus design. Quantitative and qualitative comparisons between the most and least skilled giants suggest both timing and selective joint range of motion differences between them.
REFERENCES:
Arampatzis, A. & Briiggemann, G. P. (1998). A mathematical high bar-human body model for analyzing and interpreting mechanical-energetic processes on the high bar. Journal of Biomechanics, 31, 1083-1092.
Dempster, W.T. (1955). Wright-Patterson Air Force Base. Space requirements of the seated operator , pp. 55-159. WADC Technical Report, Dayton, Ohio.
Plagenhoef, S. (1971). Patterns of human motion: A cinematographic analysis. Prentice-Hall, Englewood Cliffs, New Jersey.
Prassas, S., Ostarello, J. & Inouye, C. (2004). Giant swings on the parallel bars: a case study. In, M. Lamontage. D. Gordon & H. Sveinstrup (Eds). Proceedings the XXII International Society of Biomechanics in Sports (p 345), University of Ottawa, Canada.
Prassas, S., Papadopoulos, C. & Krug, J. (1998). Kinematic comparison of overgrip and undergrip dismount giant swings on the uneven parallel bars. In, Hartmut J. Riehle & Manfred Vieten, M. (Eds.). Proceedings of XVI international Symposium on Biomechanics in Sports, (pp. 219-222), UVK - Universitatsverlag Konstanz, Germany.
Yeadon, M. & Brewin, M. (2003). Optimal performance of the backward longswing on rings. Journal of Biomechanics, 36,542-552.
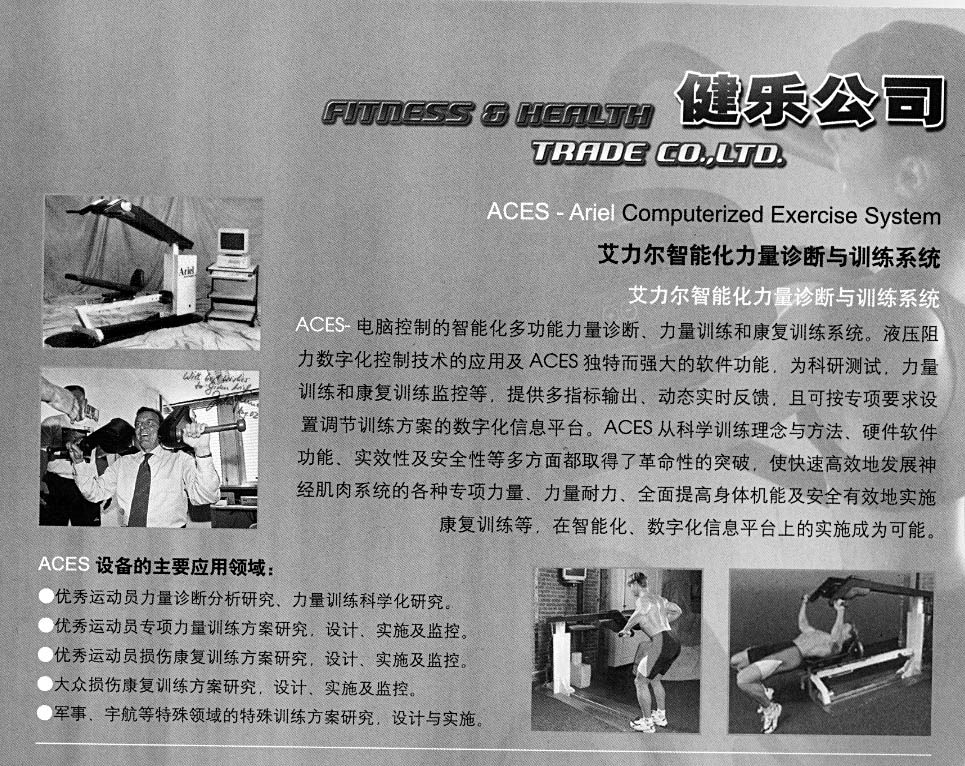
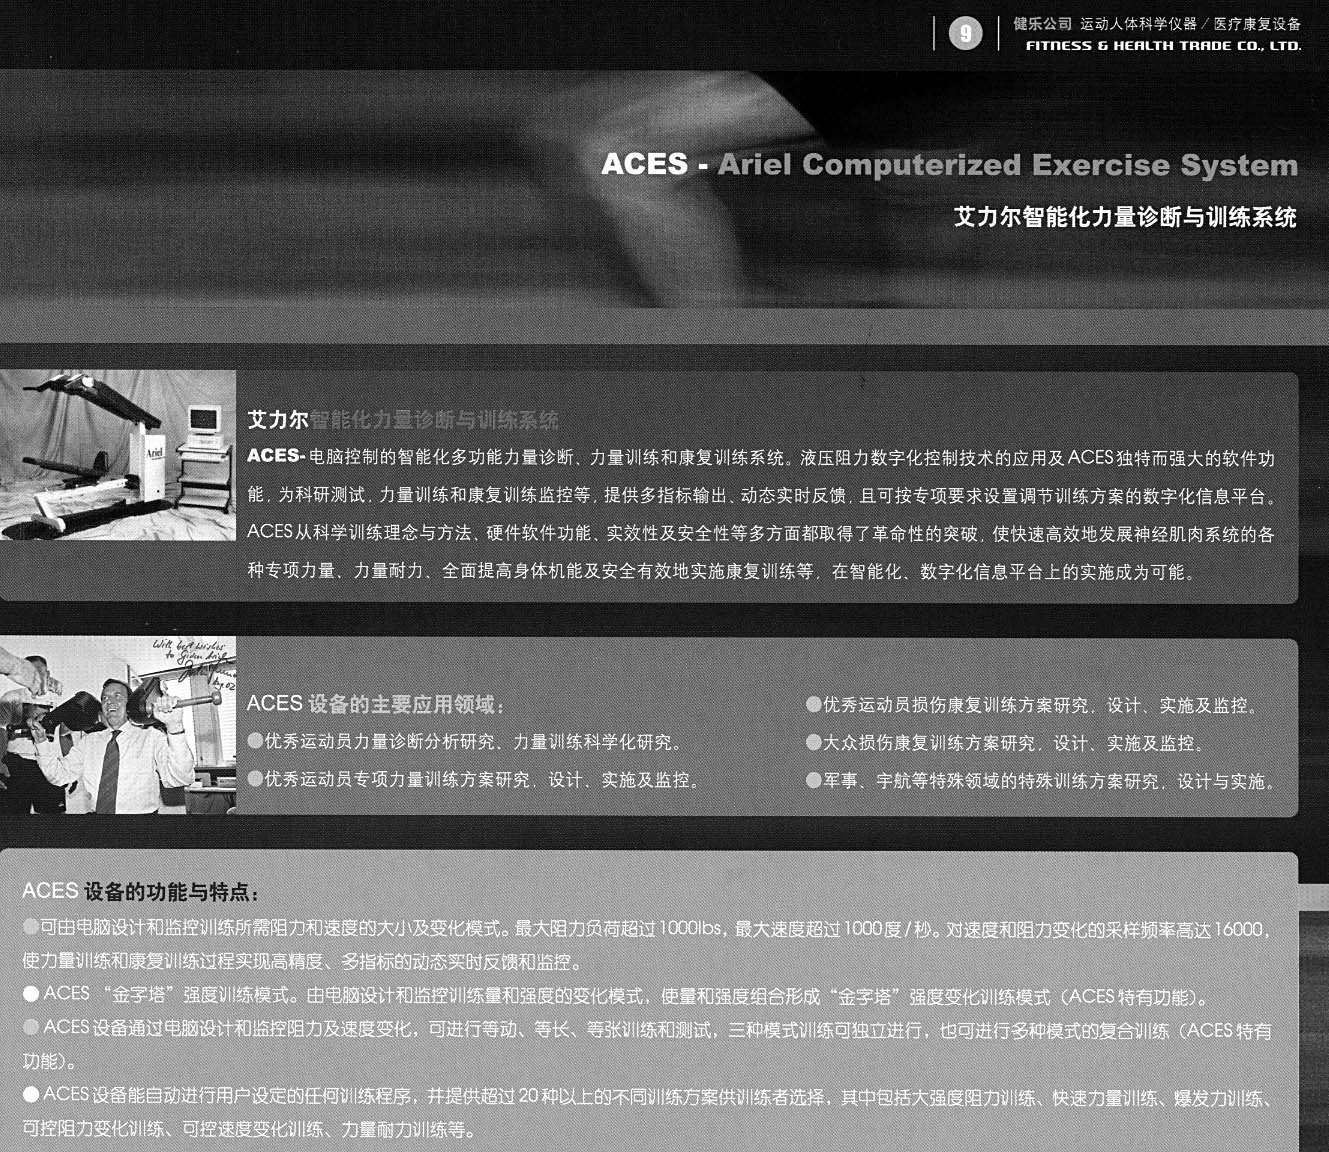
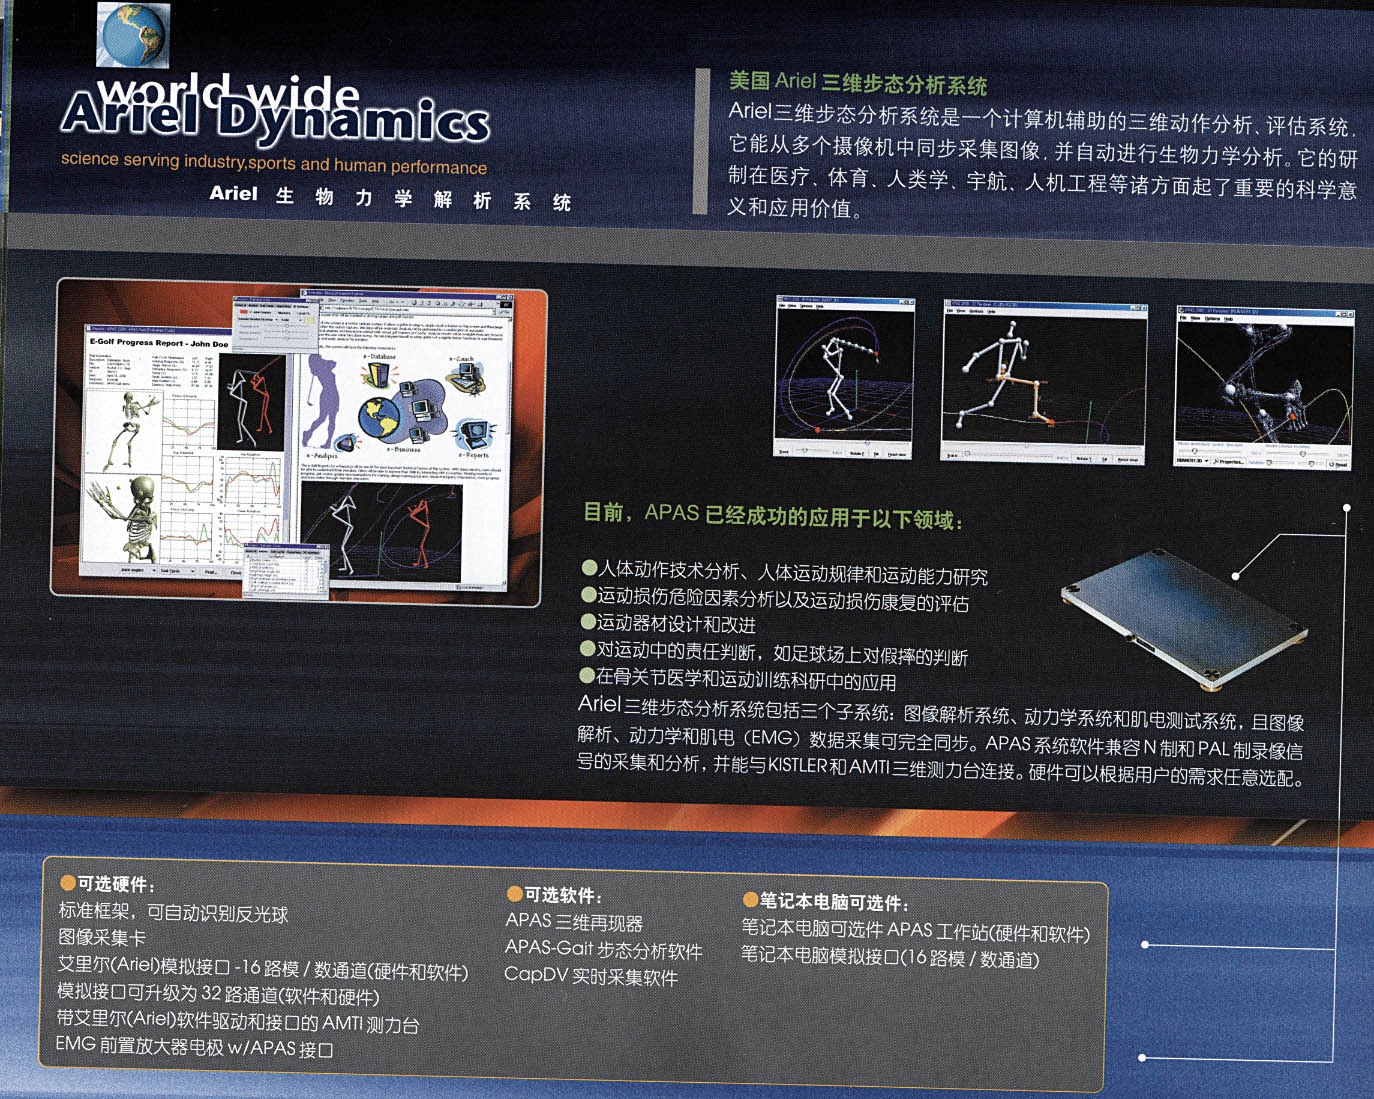
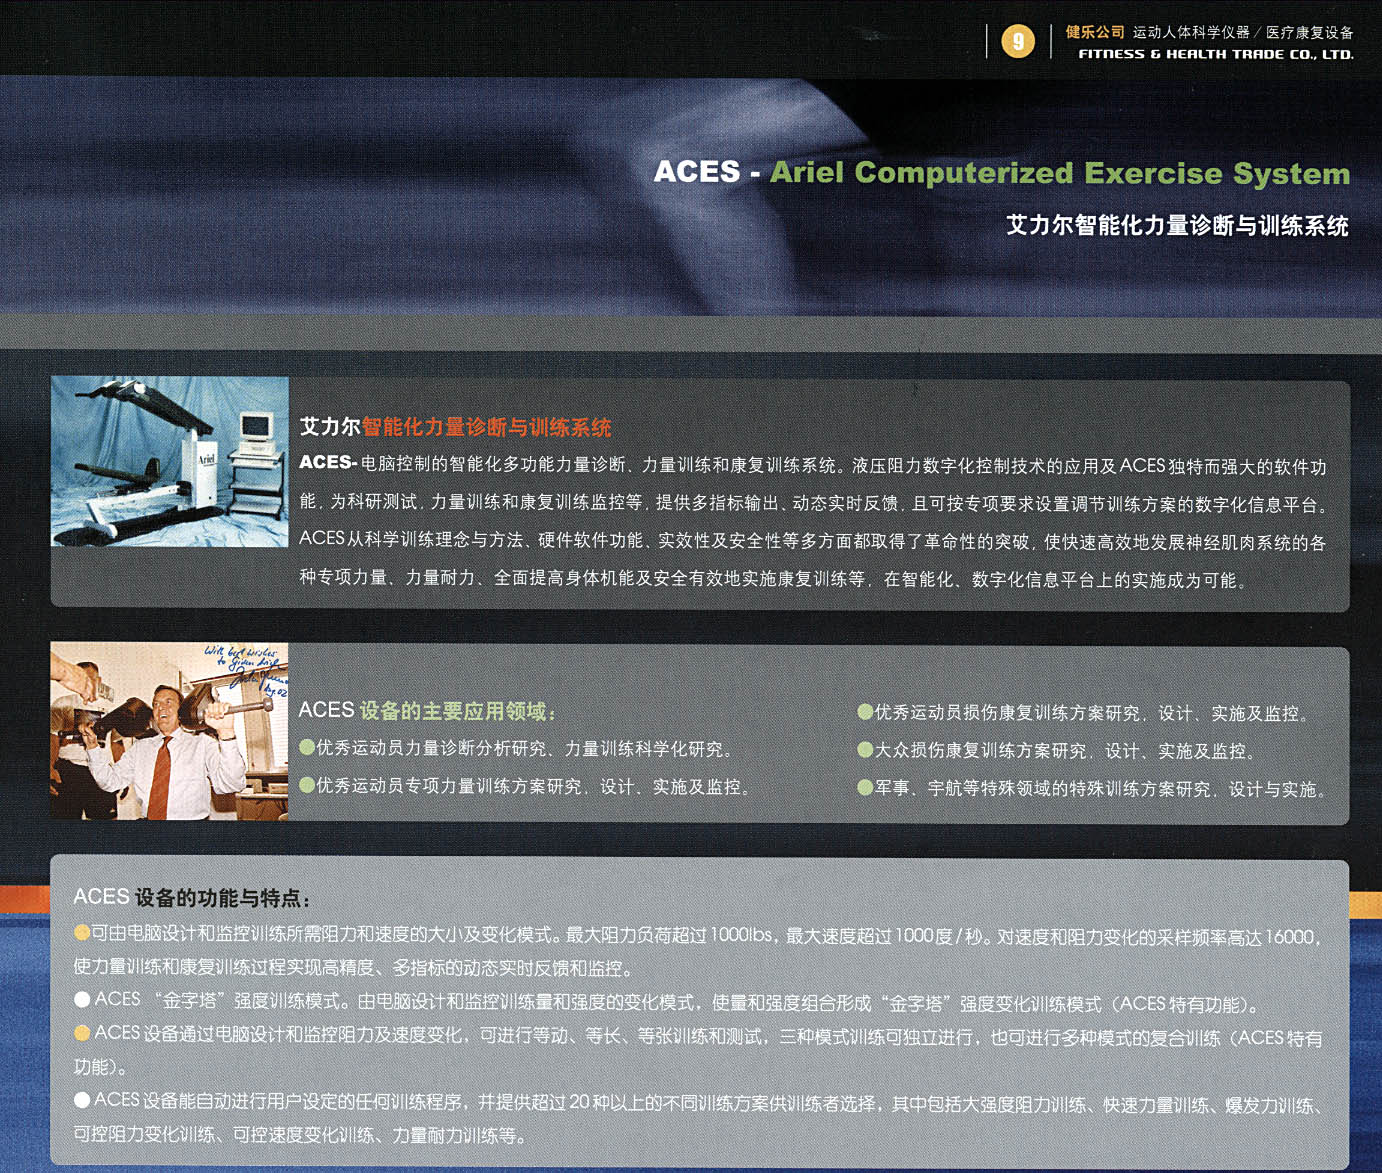
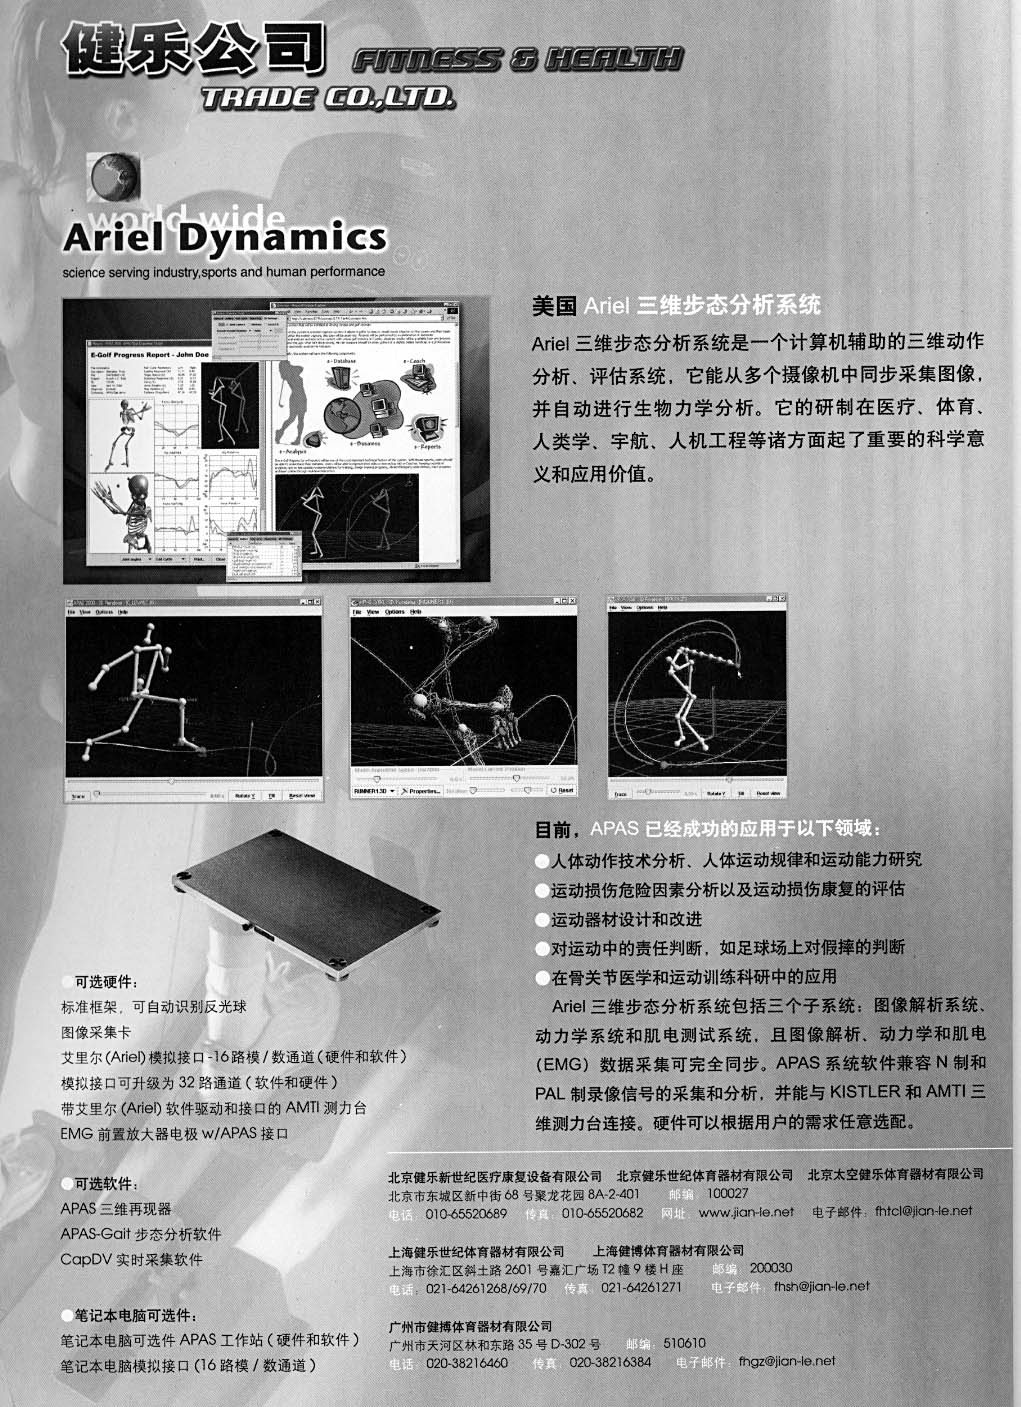
TRRDE GO.,LTD.
Computerized Exercise System
Arie
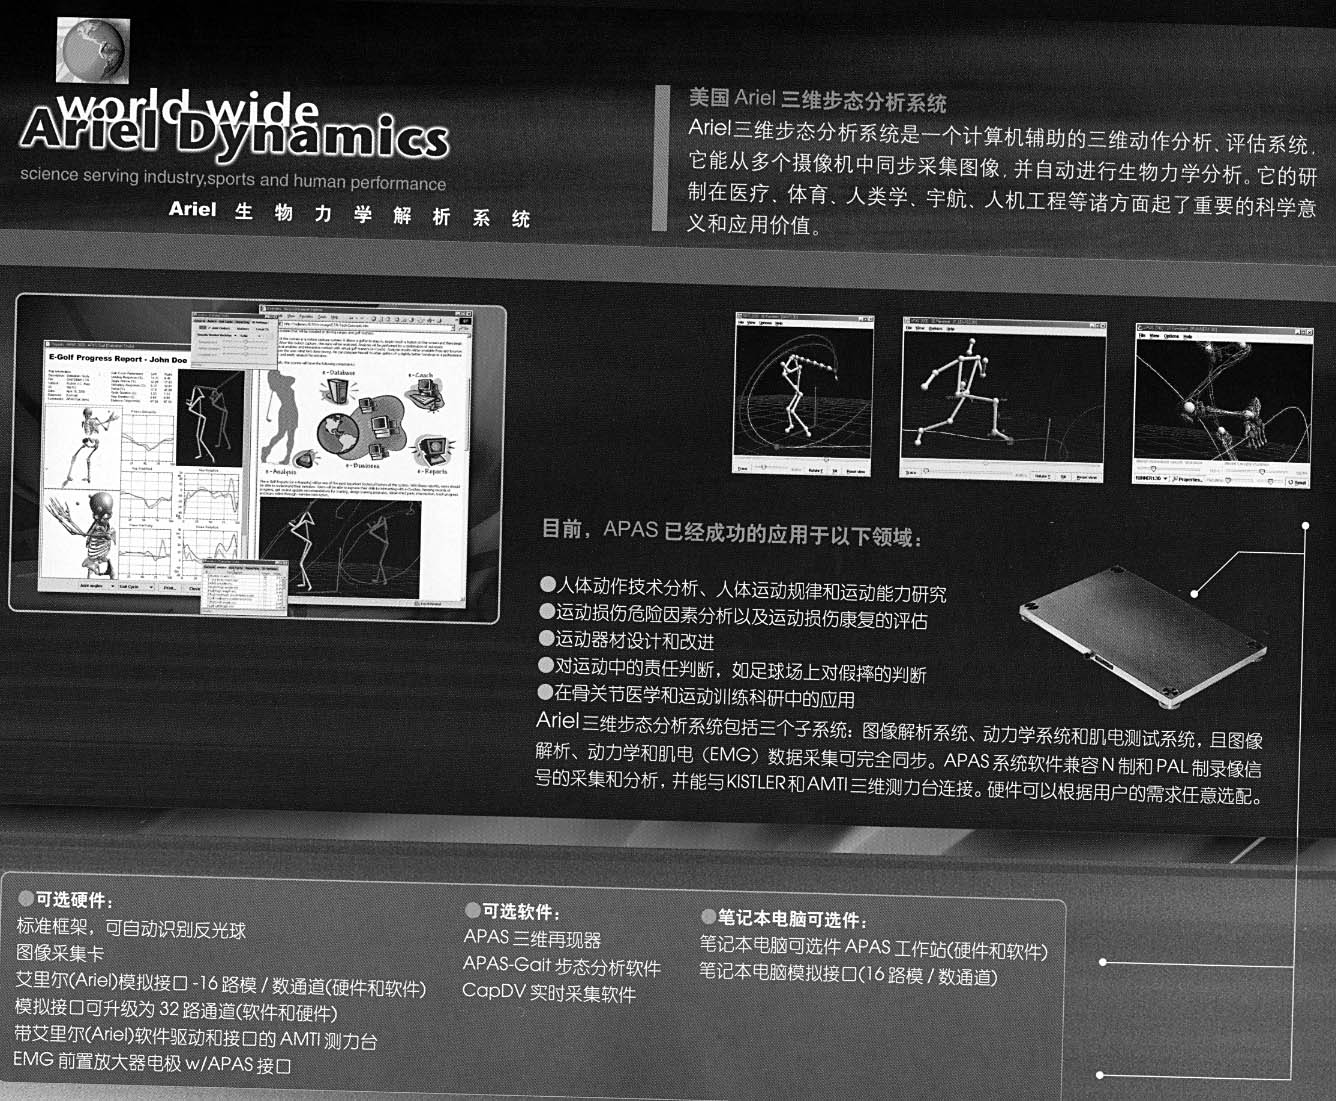
science serving industry.sports and human performance Ariel A
TRRDE CO., LTD.
science serving industry,sports and human performance
Ariel Dynamics